
The application window provides you with the ability to examine the information stored in Distribution, Relation and Sensor operators in the network, to perform operations on that information, and to construct piecewise approximations of relations using line segments and polygons.
Distributions
You can create, display and modify the contents of a DISTRIB operator. The contents show the way a variable is distributed over its range. The Y axis is in percent of occurrence, while the X axis shows corresponding values. A dialog box can provide statistics about the distribution.
Histograms
You can display the contents of a Histogram operator. The histogram displays the sum of values of one variable against the categories of another, instead of the number of occurrences of the variable, as Relation does.
Productmaps
You can create, display and modify the contents of a PRODUCTMAP operator. The contents show the attributes that products have.
Relations
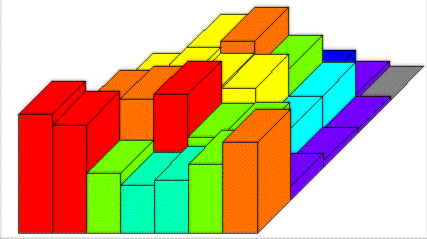
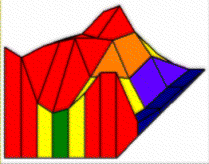
You can create, display and modify the contents of a RELATION operator. The contents show the way two or more variables are related over their ranges. There are several ways of displaying this information, including raw data and sectioned data. A three dimensional view with fading is useful for understanding complex relations.
