Time Series
Analysis
Introduction
Time Series Analysis (TSA) is
popular for estimating the process that underlies some output, or for forecasting from
some observed behaviour over time. Much of the present research activity in the area stems
from an inability to have distributed activity in the models used for process estimation
or forecasting. Each new algorithm that is proposed may alleviate a problem in one area,
while introducing a problem in another. The existing TSA methods seem to reward lack of
knowledge of the process, as there is almost no way to assist the methods to obtain a
better estimation if there is prior knowledge of the process - its limits, etc. This being
so, the practitioners of TSA are not motivated to understand what it is they are
estimating, and accept a "Black Box" result.
An active structure, which needs no
rigid boundary between model estimator and model, provides a way to distribute activity
throughout the model estimation process, and hence minimise its granularity.
The active structure can immediately use any information that is known about the process,
because its base elements are the elements of analysis, a far wider set than is found in
the typical TSA algorithm.
Existing
Approaches
The existing approaches suffer in
some way from granularity limitations. An algorithm requires a firm footing on which to
stand, and as soon as that is delimited, the areas of inapplicability are also defined.
Current approaches are briefly
described. There are several properties that should be looked for when assessing the
methods:
Is the method recursive? If the method
decomposes a time series into components, is the same method available on the components?
If a seasonal component is identified, can the seasonal component itself be seasonal on a
longer (or shorter) calendar.
Think global, act local. Does the method
detect components at any scale, or, is the granularity of the method coarse? Methods
requiring stationarity can be guaranteed to have coarse granularity.
Extensibility. How well does the output
integrate into a dynamic and extensible model framework? Can linkages be easily
established between components in separate time series analyses, or does the method suffer
from the "little room" approach - the problem has been removed from its
surroundings and taken to a mathematically small room, where it has been dissected under
controlled conditions in isolation from its context. The results may be interesting, but
if they are not easily put back into a larger framework, they are usually a dead end.
Identifiability of the components. Some
methods, such as using a Fourier transform and turning a time series into many sinusoids,
can represent the time series data very well, and yet provide not the slightest
identification with the underlying process. The process has attributes - energy, inertia,
randomness - are these attributes somehow visible in the model estimation.
Box Jenkins ARMA
The classic (1970s) Time Series Analysis approach uses a Box Jenkins algorithm to
transform the data from a stationary process into Auto Regression and Moving Average
components, the so called ARMA. The method allows estimation of actual pulses or inclusion
of forecast pulses that do not fit the ARMA methodology. A tournament is used to select
the best fit from 271 different possible models. Iteration on the parameters is then used
to find increasingly better solutions.
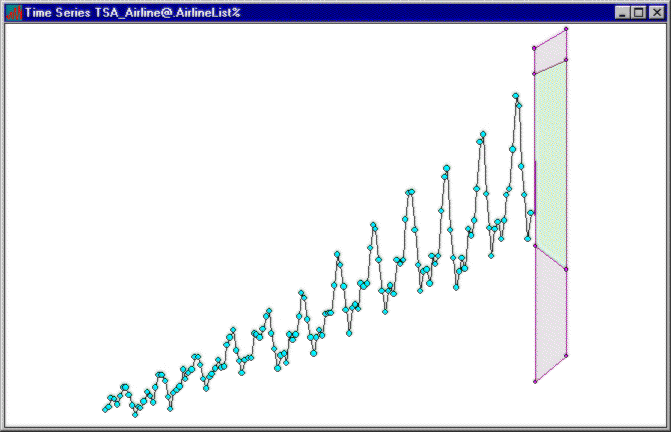
Why not use this method? It doesn't
work for a very large class of curves - it even shouldn't be used on the airline flights
example used to introduce it because the variance is not constant over time. The
differencing frequently used to make the data more amenable to analysis (effectively,
taking the first derivative) further hides the connection to the underlying process. The
projection cannot be bounded or controlled, and is not readily useable in other systems,
or even in the same system for a different time series.
Wavelets
The wavelets method is used in image recognition. The object to be recognised may appear
at a wide range of scales, so some scale invariant method must be used. It is an attempt
to embed local context sensitive processing in the recognition process. The method can be
used on non-stationary time series because cyclic detail at any scale can be recognised.
The method distances the results
even further from the context than does ARMA. An image of an aircraft at one scale is not
usually found buried in an image of an aircraft at quite another scale, but in TSA there
may well be a connection between the two. Wavelet methodology for time series analysis
assumes independence of components at different scales, or more precisely, has no way of
linking the effects, as this would invalidate the premise of the mathematical analysis.
One should expect complex interactions among the elements of a time series, but this
method will not reveal them, except to the trained eye looking at the results of the
analysis, which defeats the object. The results are not immediately useable in other
systems.
Artificial Neural Networks
This approach relies on building layers of nodes, each connected to a preceding layer
through weights. By adding more and more layers, and incorporating memory delay lines so
previous inputs can be stored, the output of the network can come to resemble the time
series. The method offers recursive local error elimination, which is good.
The method is poor on the grounds of
identifiability - there will usually be no obvious point in the neural network that
coincides with an obvious, and perhaps easily measurable, point in the process, so
verifiability is almost non-existent. Processes that involve threshold switching (bouncing
off a limit, say) will be very difficult to handle. Ignoring identifiability, there is no
way to couple analytic knowledge about the process into the ANN - it has its own mechanism
for operation, antithetical to analytic operators.
A New
Approach - Active Structure
All of the above methods are
attempting to solve a distributed problem by either using simple mathematics or resistors.
A time series may contain:
A slowly varying ramp Seasonal variations Cyclic variations Level changes Pulses Limit behaviour
The components will usually have an
influence on each other, making them difficult to tease out into separate independent
components, but this is what the various algorithmic approaches demand.
The active structure approach to TSA
involves creating new elements at a basic level (analytic operators and variables), and
combining these to form the different components of the time series, effectively exploding
the information in the time series into analytic structure. This guarantees the finest
granularity possible, and enables the interweaving of the components - the amplitudes of
the elements of the seasonal component may be correlated with the base ramp.
It should be obvious that a system
for process estimation and forecasting with even a trifling amount of context can do far
better than the most sophisticated system with none. The active structure can be given as
much, or as little, context as is available - that is, information on hard bounds on any
component, probability known external to the series, etc.
What Is an Active Structure
It is a collection of variables,
operators and links through which information flows in any direction. Information is
propagated and stored in the links and at the variables. A change in the information in a
link will cause an operator, to which it is connected and to which the change is
"flowing", to become active and process the changed information. The operator
will then usually propagate changed information in one of its links, including the link on
which the incoming change occurred. Information flowing through the links can be a single
values or a range. The activity in the network is "micro-scheduled", so there is
no limit on granularity imposed by an external algorithm. The representation is
extensible, merely by adding more operators, and it is identifiable. A known limit on the
seasonal amplitude, say, can be added, ensuring that predictions take into account
any available information. An active structure can have sophisticated operations embedded
in it. A projection variable can have a probability distribution generated by the
analysis, and probabilistic relations can exist between the variables. If a projected
value becomes known and there is no time to rerun the analysis, the relations will
constrain the distributions of the still unknown projected values.
A Simple Example
We have a time series
with a seasonal component, a ramp, and possibly some pulses (which may be valid events or
measurement errors). The structure of the network near the time series values becomes: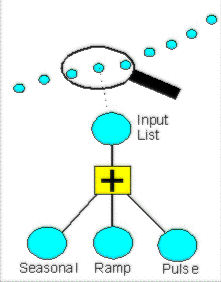
The Ramp variables provide a slow
change in value by minimising the differences between them. The Seasonal variables
themselves are split into a repetitive component and a pulse component through another
PLUS operator. The Pulse variables are there to accommodate divergences which the
Ramp and Season variables cannot absorb. The structure can be used recursively - once the
ramp and season have taken away their components, and level shifts have been accommodated,
any remaining correlation in the Pulse values can be operated on in the same way.
This permits finding features at
multiple scales and recursively minimising errors.
Correlations can be sought between
the levels of processing, so a ramp on one set of seasonal multipliers may be correlated
with the base ramp or the peak amplitudes of another seasonal influence. The resulting
model, with correlation connections across levels, is far more indicative of the
underlying process than an estimation process which assumes independence of the
components.
The knowledge network approach
offers:
| Identifiability | |
| Recursive error elimination | |
| Cross linking of levels | |
| Other knowledge, bounds etc., can be used to control prediction | |
| Easy combination of result with other analytic structure - we forecast the ticket sales, now let's forecast the new planes we need |