The format of the TRENDER function is:
TRENDER(ControlList%,TrendSettings%,OutputList%,AmountList%,QuantityList%,NextLevelList%,ReturnString$)
The TRENDER function is designed to find trends in discretised data. It receives arrays of values, and then when it detects a trend, it controls the search for components that contribute to the trend. On completion of searching, the function returns a string representing its findings.
The parameters:
The TRENDER assumes the dimension variables of the productmap are unset, and can be set to any combination allowed by the limit conditions list. For levels greater than one, a store level and backtracking is used, so the previous level TRENDER is not required to relinquish control.
An example of an instant coffee product will be used:
200 g jar of Freeze Dried Instant Coffee - branded Lavalla
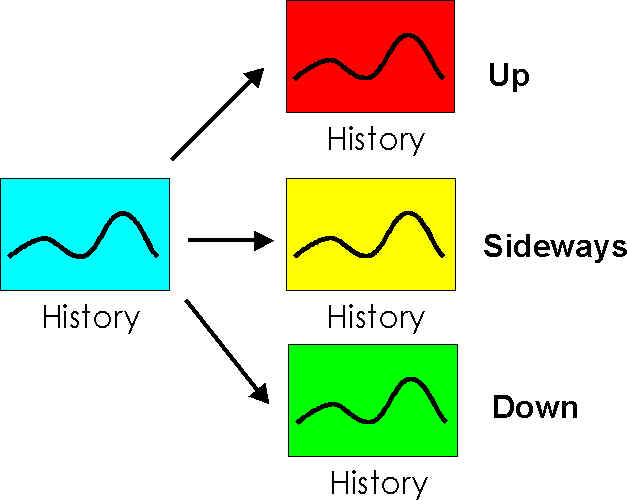
When a trend is found in sales of this product, the cause could be
Up
Increased sales of Instant Coffee
Increased sales of the Lavalla brand - not to be considered if only one product
Sideways
Increased sales of 200g jars of coffee generally
Increased sales of Freeze Dried coffee at the expense of other types
Change in sales of competitive product - including distributor's own products
Down
Increased number of stores selling product
Change in price of this or competitive product
Increase in some segment of stores - population type, region
The TRENDER function controls the direction and depth of search. Diagrammatically, each potential step in the search appears as
There are rules about which search steps are possible -a sideways search followed by another sideways search is not possible, for instance. It is also not possible to recurse.
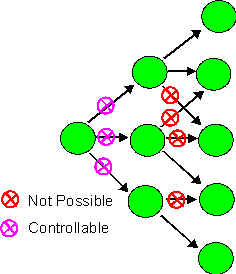
The limit list provides control over which of the possible search steps are permitted - searching up or sideways within the stores dimensions is not permitted.
If the search up finds a full explanation of the trend - sales are up generally - then the search terminates. Otherwise, any significant contribution to the trend in the up direction is stored.
The search sideways may result in combining several dimensions - 200g and Freeze Dried, if each show a small contribution - or a search down from some other product or group of products.
The search down attempts to find one or more specific causes in the sales data - an attributable cause is more than 25% of the trend (by value). Searching along a particular path will terminate when no component shows more than a 15% contribution to the trend. Several paths will be joined if together the trend contribution would be above 25% - region and population, say.
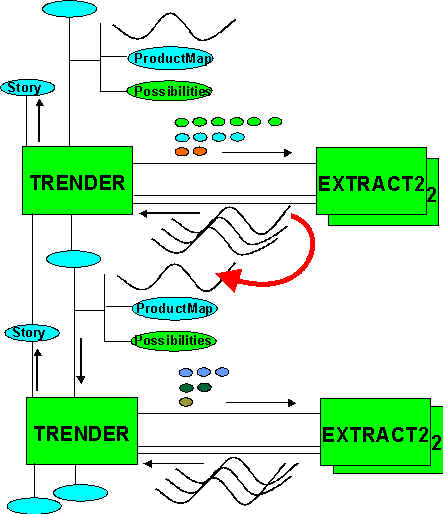
TRENDER operators are intended to function in a cascade fashion, as the diagram shows.
Data from which a trend is to be extracted is continually normalised against overall and component data. Product sales data will be normalised against category and subcategory data (so a general trend will disappear in the product data).
Small trends (a few percent) in related dimensions - size of pack - will be used to normalise the data.
Seasonal fluctuations in sales - represented by data on the previous year's sales - will also be used to iron out fluctuations in the specific product sales data.
Compensatory trends - sales dipped 5% a few weeks ago and have now risen 5% - will be ignored.
When this smoothing has been completed, any remaining trend will be estimated, and the searching for its components begins.
The time period over which trends are estimated varies, depending on the expected delay in response to change:
Distribution level - the number of shops selling the product - 8 weeks.
Price change - 4 weeks.
Introduction of new product - 2 weeks.
As the cause is not known when the trend is detected, trends are looked for over different timeframes. Searching will follow different paths, depending on the trend timeframe.
A search for components might yield
Components B and C would be singled out for further analysis. The component curves without trend are tracking the parent curve, as they have been normalised against it.