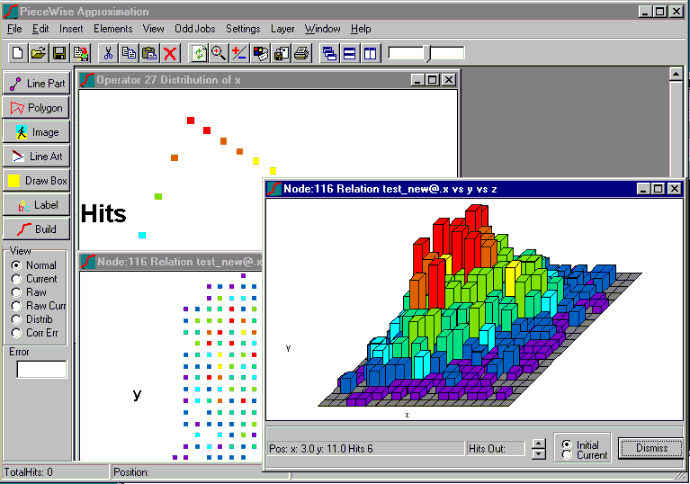

The graphical window provides you with the ability to examine the information stored in distribution, relation, histogram and productmap operators in the model network, and to perform operations on that information.
Distributions
You can create, display and modify the contents of a DISTRIB operator. The contents show the way a variable is distributed over its range. The Y axis is in percent of occurrence, while the X axis shows corresponding values. A dialog box can provide statistics about the distribution.
Correlations
You can create, display and modify the contents of a RELATION operator. The contents show the way two or more variables are related over their ranges. There are several ways of displaying this information, including raw, current (the intersections of current ranges) and sectioned (or 'sliced and diced') data.
You can link objects with their attributes, similar to a large predicate, as a way of storing knowledge about products, for example.
Calculations on Relations
You can perform calculations on the values and frequencies of occurrence held in the
relation. You can save the resulting calculations as lists.
Calculations on Calculations
You can perform a wide range of calculations on the stored calculations.